
Lenders, investors, analysts, internal management, and other interested parties calculate financial ratios to decipher what financial statements are really saying about the state of a business.
How it works
Financial ratios are used to assess the financial standing of a business and identify any problem areas that might affect its future prospects. The process involves comparing two related items in the financial statement, such as net sales to net worth or net income to net sales, and using those ratios to measure the relative performance of the company. There are many different ratios to choose from, depending on the purpose—for example, whether the purpose is to measure the company’s ability to provide a good return to shareholders, its capacity to handle debt, or the efficiency with which it operates. The ratios can also be used to compare a business with its competitors or in comparison to specific benchmarks within the company to determine how consistent its financial results are.
Top financial ratios
These are some of the ratios most
commonly used by people involved with assessing businesses. They are best considered comparatively and in the context of the economic climate. The ratios are for analyzing established companies, usually public ones with shares traded on the stock exchange—start-ups and small-tomedium enterprises generally do not have a full enough range of figures to provide any kind of reliable guide.
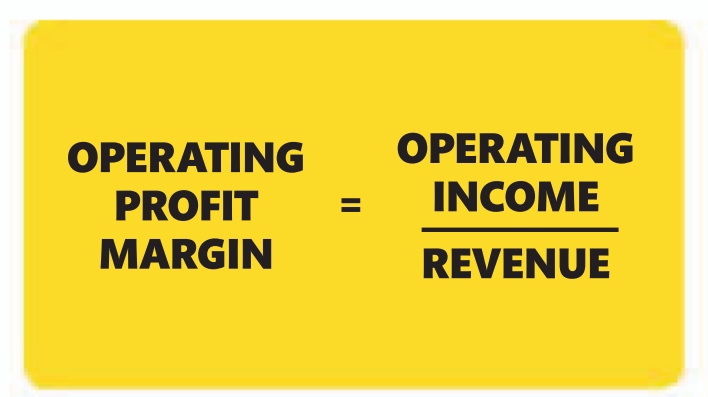
Profitability ratios
These are used to see how effective a company is at
generating profit. Profitability ratios may mirror investment valuation ratios. One example is the operating profit margin ratio. A high ratio is good, as it indicates that a high proportion of revenue (gross income) converted into operating income (profit minus costs).
Other profitability ratios
❯ Return on equity (ROE) is measured as net income after tax / shareholders’ equity. The higher the ratio, the greater the profitability, but not if a company is relying too heavily on borrowing.
❯ EBITDA to sales ratio is measured as EBITDA (earnings before interest, taxes, depreciation, and amortization) / revenue. It gauges the profitability of core business operations. The higher the margin, the greater the profits.
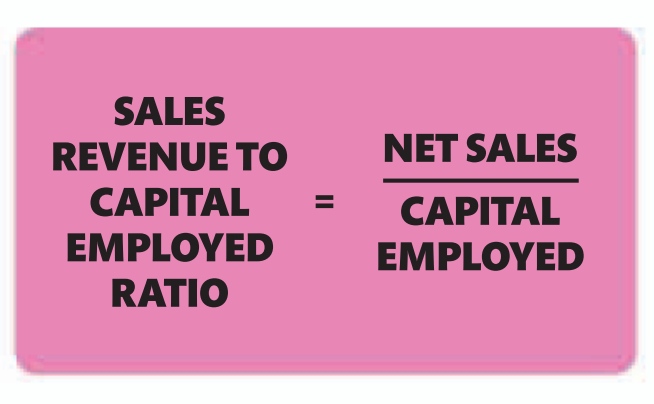
Efficiency ratios
These show how efficiently the company uses its assets
and resources to maximize profits. An example is the sales revenue to capital employed ratio, which indicates a company’s ability to generate sales revenue by utilizing its assets. Similar ratios can examine how quickly the company settles its bills and invoices
Other efficiency ratios
❯ Accounts receivable turnover ratio is measured as net credit sales / average accounts receivable. It shows how efficiently a company turns sales into cash. The higher the ratio, the more frequently money is collected.
❯ Inventory turnover ratio is measured as the cost of goods sold / average inventory. It shows how efficiently a company manages its inventory level. A low ratio usually equates to poor sales.
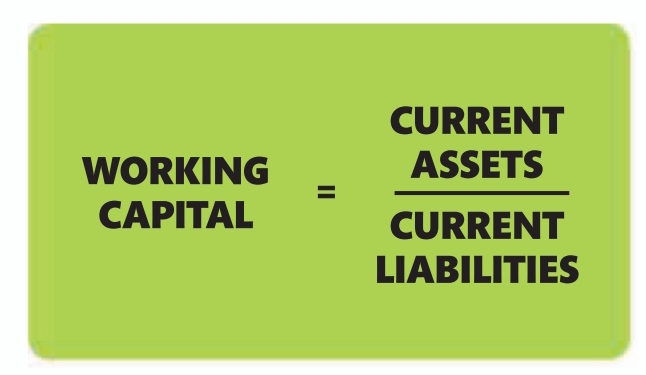
Liquidity ratios
This group of ratios reveals whether or not a company
has enough cash or equivalent assets to meet its debt repayments. An example is the working capital ratio (also a measure of efficiency), which indicates whether a company has enough short-term assets to cover its short-term debt.
Other liquidity ratios
❯ Cash ratio is measured as total cash
(and equivalents) / current liabilities. It shows whether a company’s shortterm assets could repay its debts. A high ratio is seen as favorable.
❯ Quick ratio (acid-test ratio) is measured as current assets minus inventories / current liabilities. It shows how easily a company can repay shortterm debt from cash. The higher the ratio, the more easily it can pay.
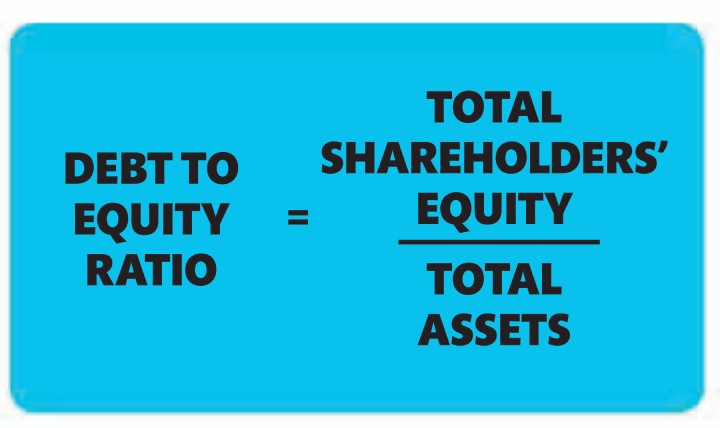
Solvency ratios
While liquidity ratios look at a company’s short-term ability
to meet loan repayments, solvency ratios indicate the likelihood of a
company being able to continue indefinitely with enough cash or current assets to pay its debts in the long run. An example is the debt to equity ratio.
Other solvency ratios
❯ Interest coverage ratio is measured as EBIT (earnings before interest and tax) / interest expense. It indicates how easily a company can pay the interest on its debts. The higher the ratio, the more easily they can pay.
❯ Debt ratio is measured as total liabilities / total assets. It indicates the percentage of the company’s assets that are financed by debt. A low ratio is considered favorable.
Investment valuation ratios
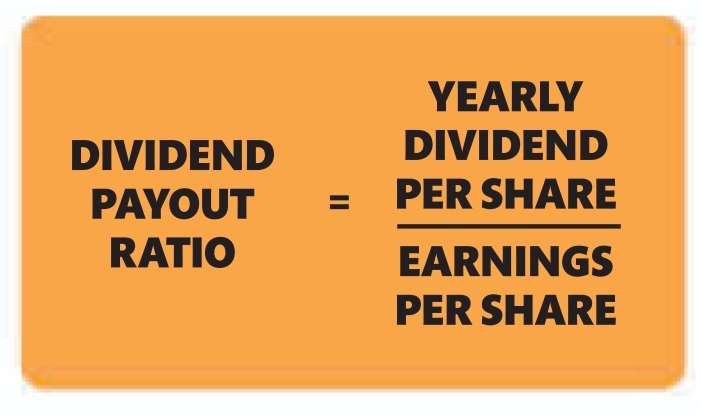
Thes ratios are typically used
by investors to gauge the returns they are likely to get if they buy shares in a company. An example is the dividend payout ratio. It indicates how well earnings support the dividend payments—more mature companies tend to have a higher payout ratio.
Other investment valuation ratios
❯ Net profit margin ratio is measured as profit after tax / revenue. Another measure of a company’s profitability, it is also useful for comparing a company with competitors. The higher the ratio, the more profitable the company.
❯ Price to earnings ratio is measured as market value per share / earnings per share. It indicates the value of the company’s share price. A high ratio demonstrates good growth potential.
WARNING
Investors beware Ratio analysis must be used over time—at least four years—to understand how a company has reached its current position, not just what the position is. For instance, if debt has suddenly gone up, it could be because the company is branching out into new areas of potential profit, or to limit the damage of a poor past decision.
10–14%
the minimum return on investment (ROI) needed to fund a company’s future

Leave a comment