
Business intelligence (BI) is an umbrella term referring to the variety of software applications companies use to access and analyze the massive amounts of raw data they have at their fingertips.
How it works
BI relies on software programs and computerized systems for collecting and integrating data in order that a business can report on its activities, both past and present. The tools allow staff to pull relevant data
from the company database. The marketer then views the information on a computer screen using a data visualization tool known as a dashboard, which can also be used for real-time monitoring of business operations.
Business intelligence process
BI tools allow retrieval of specific relevant data by specifying the terms of the intelligence they need (such as real-time sales compared to previous year’s sales).
Collect source data Company gathers raw data via several operation systems.
SUPPLY CHAIN MANAGEMENT (SCM)
Data from SCM sources
ENTERPRISE RESOURCE
PLANNING (ERP) Manages
company data
WEB LOGS Data relating to activity on corporate or
e-commerce sites
TRANSACTIONAL DATABASE
Data of current commercial transactions
CUSTOMER
RELATIONSHIP MANAGEMENT (CRM)
Data from CRM sources
EXTERNAL DATABASE Information
gathered from sources outside the company
Extract, transform, load: ETL process
ETL system pulls raw data from the source, formats it, and loads it for use.
ETL SYSTEM Migrates raw data to data warehouse
- Translates data codes
- Transposes data columns and rows
- Splits and separates information
- Creates data archives
Store data Business uses data warehousing to integrate and bank data in a readily accessible form.
DATA WAREHOUSE Flexible access to data
- Data from across organization
- Data from outside organization
- Current data
- Historical data
Retrieve and analyze Staff can fetch data to answer
specific questions about what is happening in the company.
SPREADSHEETS Form primary BI tool to display data (basic or advanced)
OLAP CUBES Online analytical processing cubes enable 3-D analysis of three variables on spreadsheet
DATA MINING Allows the sifting of data to find patterns and relationships
REPORTING TOOLS Help users develop and produce reports
TRACKING SALES
This dashboard shows the sales a company actually makes as a percentage of expected sales.
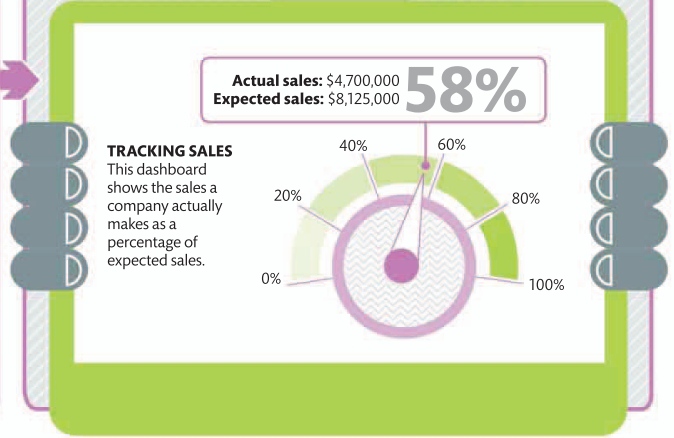
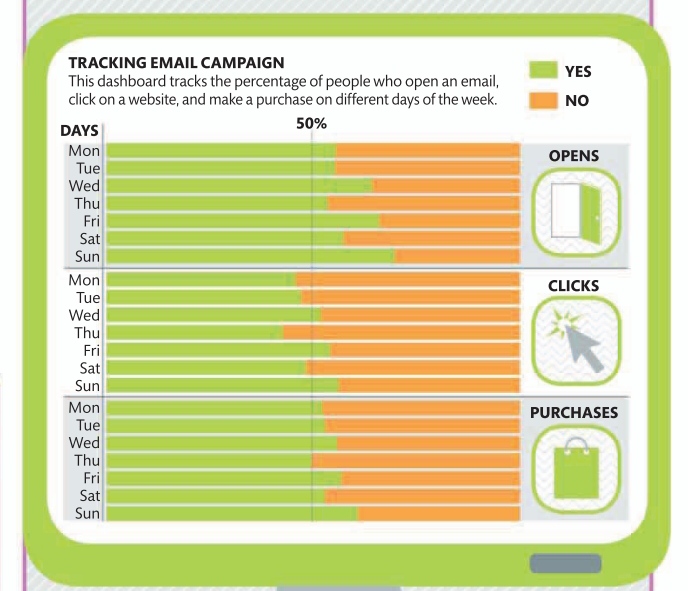
Digital dashboard
Displays regularly updated business results using customized graphics.
NEED TO KNOW
❯ Star schema Simplest format of online analytical processing (OLAP) in data warehouse
❯ Data quality (DQ) Condition of company’s master data, which should be complete and accurate
❯ Slice and dice Process in which large amounts of data are broken down to help analysis
14%
the increase in sales per employee if data usability is improved by 10%

Leave a comment